skip to main
|
skip to sidebar
Map Catalog
Friday, April 23, 2010
Index Value Plot
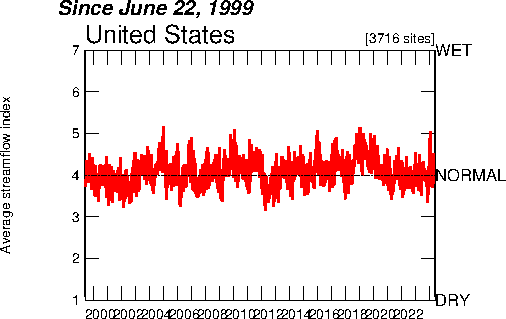
A plot of the average historical stream flow in the United States. Ranges from 1999 to 2009.
http://waterwatch.usgs.gov/?m=real&w=plot
No comments:
Post a Comment
Newer Post
Older Post
Home
Subscribe to:
Post Comments (Atom)
Followers
Blog Archive
▼
2010
(53)
▼
April
(52)
Cartographic Animation
Bivariate Choropleth Map
DOQQ
Cave Painting Map Catal Hyuk 6200 bc
T-O Map
Burmese Buddhist Map
Portolan Chart
Ptolemic Geocentric Map
Babylonian Clay Tablet Map
LIDAR
Nominal Area Choropleth Map
Proportional Circle map
Bilateral graph
Lorenz Curve
Index Value Plot
Scatter Plot
Population Profile
Climograph
Windrose
Triangular Plot
Parallel Coordinate Graph
Histogram
Box Plot
Stem and Leaf Plot
Similarity Matrix
Correlation Matrix
Star Plot
Classed Choropleth Map
DEM
DLG
DRG
Isopleth
Isopach
Isohyets
Isotachs
Isobars
Black and White Aerial Photograph
Infrared Aerial Photo
Statistical Map
Cartogram
Flow Map
Isoline Map
Choropleth Map
Dot Distribution Map
Mental Map
Planimetric Map
Hypsometric Map
PLSS Map
Cadastral Map
Thematic Map
Topographic Map
Propaganda Map
►
January
(1)
About Me
KeeleyA
View my complete profile
 A plot of the average historical stream flow in the United States. Ranges from 1999 to 2009.
No comments:
Post a Comment